2020
HIDA Corporate Images
generative graphics from scientific data
Real scientific datasets – from earthquakes in Chile to neuronic signals in human brains – are translated into computer generated, aesthetically loaded visuals for HIDA's corporate communication.
CLIENTHelmholtz Information & Data Science Academy (HIDA) / design distillery
THE STORYHIDA on re:publica
E. Coli growth rates
Code & translation
14 datasets are the basis for 26 algorithms. Each one outputs several variations of a graphic.
Circadian oscilator
Alaskan permafrost thoughts
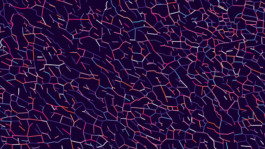
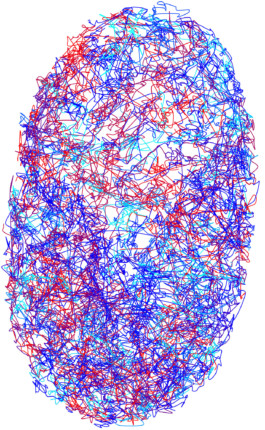
The datasets are taken from scientific research within HIDA’s several institutes and universities. Covering fields like neurology, climate, biology, geology, IT etc.
The results are no classical information graphics, but rather aesthetic illustrations of otherwise invisible data.
Brain synchrony, E. Coli growth rates, density matrix elements of Urea
Density matrix elements of Urea
Density matrix elements of Urea, neural signals from interacting persons
Data radiotherapy dose, earthquakes in Northern Chile, neural signals from interacting persons
Rate of change of ozone
Alanine, earthquakes in Northern Chile, rate of change of ozone, neural Signals from interacting persons
Amino acid positions for proteins aligned to each other
The process
Data is collected in sheets. Exported CSVs are loaded into Processing . Specifically designed algorithms then transform millions of data points into geometry, colors and motion.
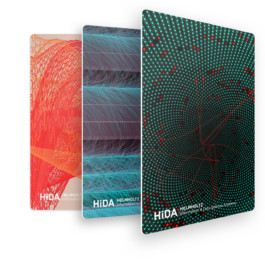
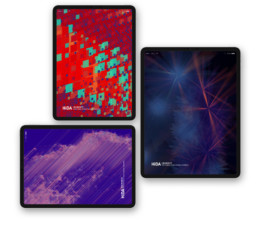
The programs allow exports of PDFs for print quality and image sequences for animation.
More works
made with Lay Theme